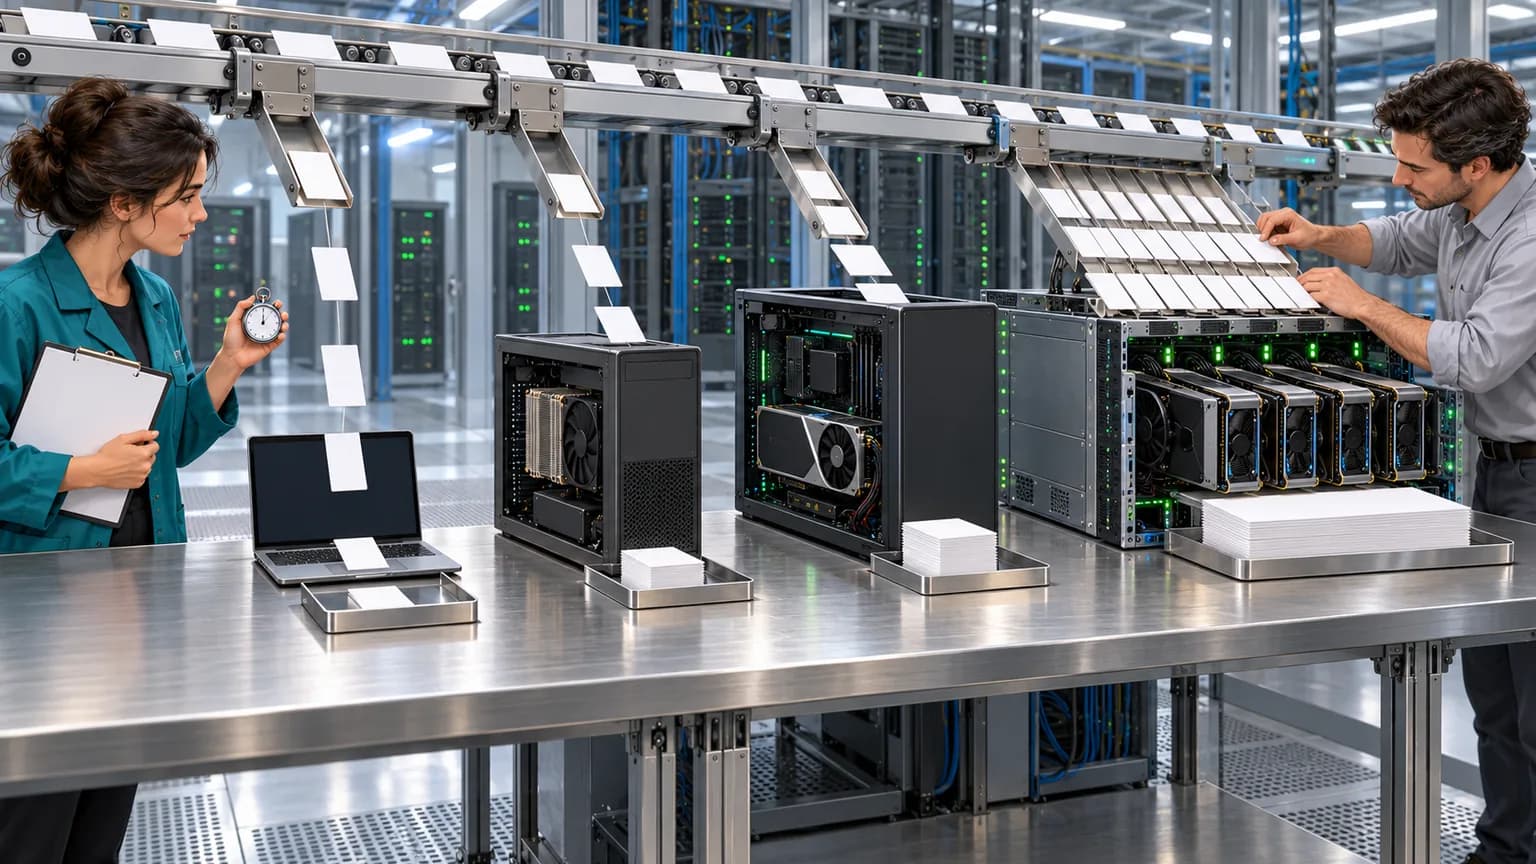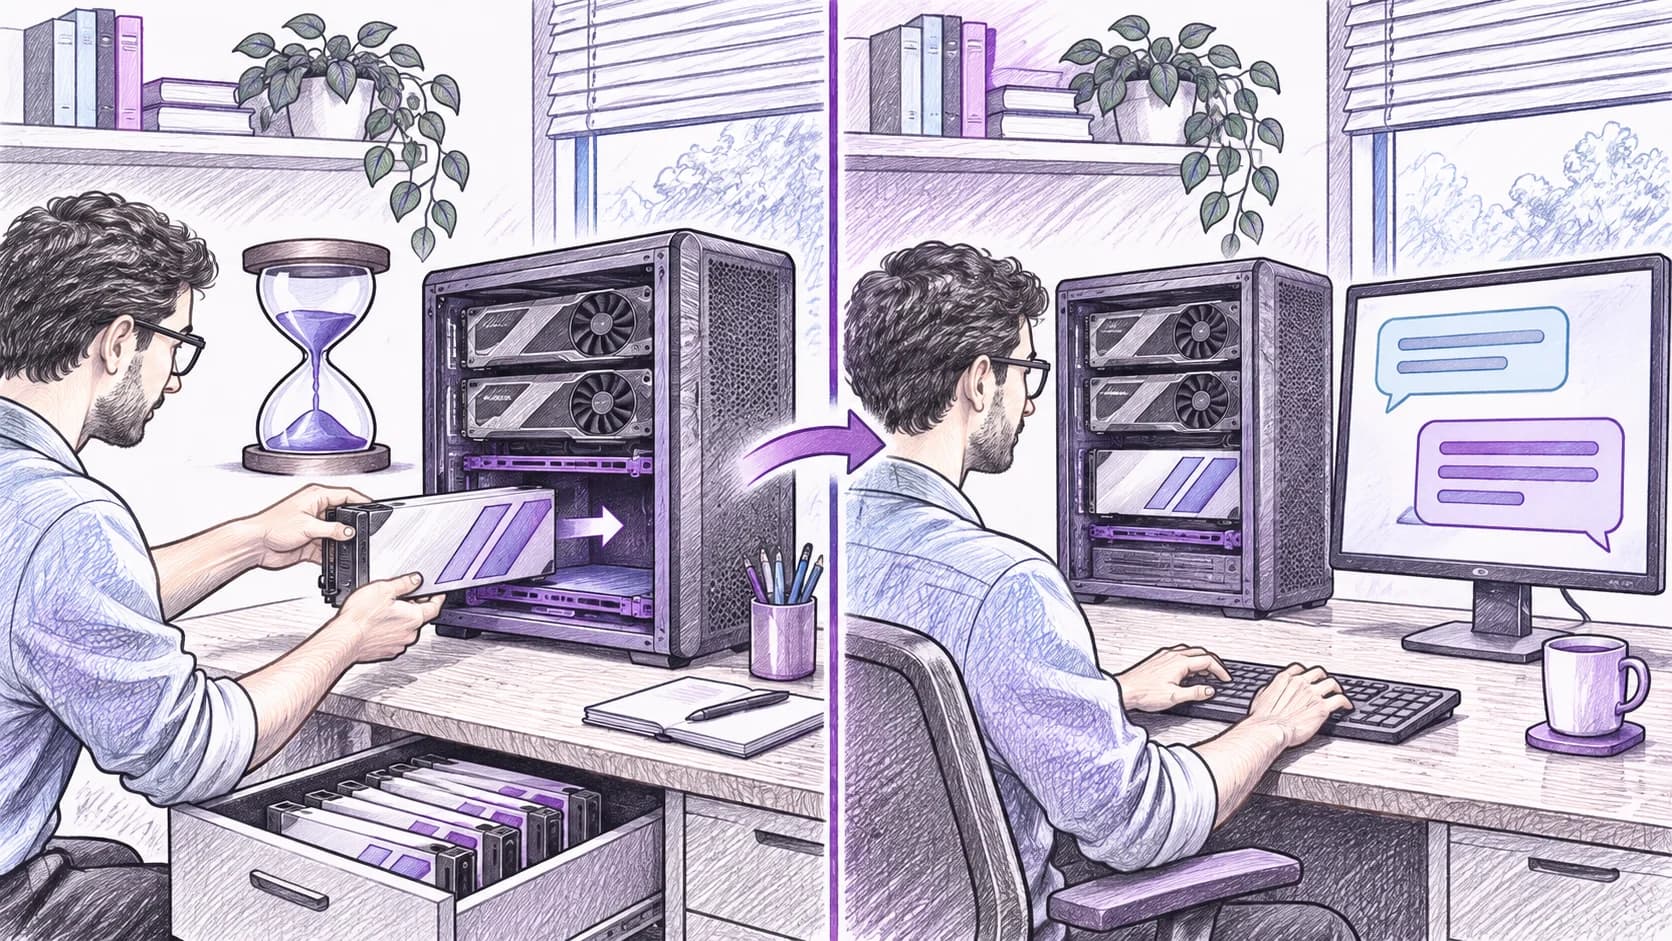
If the first request to local Ollama is slow and the next one is noticeably faster, start by checking model loading: look at load_duration and compare identical requests. If the delay repeats on every call, separately investigate prompt processing, generation, and memory contention. A single keep_alive setting does not eliminate all of these causes.
This analysis is intended for an enterprise assistant developer and a local server administrator. The documentation was verified on November 4, 2026. The commands below describe the documented diagnostic sequence; in this work, the Ollama server, GPU, and real requests were not run. Time values were not measured, and no speedup is promised. This refers to a locally loaded model, not the Ollama cloud route.
Contents
- How to distinguish four sources of latency
- Which metrics to read in the API response
- The first request is slow, the repeat is faster
- How to check whether the model is in memory
- When to use keep_alive and when to free memory
- If loading is minimal but the wait remains
- Why pauses reappear under load
- What to check if the GPU stopped being used
How to distinguish four sources of latency
User wait time and token output speed answer different questions. First determine where the delay occurs, then change the configuration.
| Symptom | Working hypothesis | What to compare |
|---|---|---|
| Slow after idle, faster on immediate retry | The model is loading into memory | load_duration and whether the model is in memory |
| The longer the history, the longer the wait | Input context processing | Input composition and prompt_eval_duration |
| The response starts, but takes a long time to finish | Generation of output tokens | eval_count and eval_duration |
| One user gets acceptable performance, several are waiting | Contention or queueing | Parallel load, memory, and logs |
These are diagnostic hypotheses, not automatic conclusions based on the look of the interface. For example, a pause before the response may happen in your application before Ollama is even called. So compare server observations with the client's full request time.
Which metrics to read in the API response
In the Ollama usage metrics documentation it states:
load_duration— model load time;prompt_eval_duration— time to process uncached input tokens;eval_duration— time to generate output tokens;eval_count— number of output tokens;total_duration— total response processing duration reported by the API.
Time values are expressed in nanoseconds. To convert duration to seconds, divide by 1,000,000,000. Average generation speed can be calculated as eval_count / (eval_duration / 1e9) if the duration is positive. This is a calculation based on response fields, not a measurement of a specific server's speed in this article.
Do not present this as time to the first visible character. In streaming mode, the usage fields arrive in the final chunk with done: true; for user-facing latency, separate client timestamps are needed. If the final chunk is missing, you may not have the full set of server metrics.
The first request is slow, the repeat is faster
According to the official FAQ, by default the model remains in memory for five minutes after use. After unloading, the next request again requires loading. The keep_alive parameter sets how long the model is kept for a specific request; a negative value keeps it loaded indefinitely, while zero unloads it after the response.
Recommended diagnostic sequence:
- Choose one already installed local model.
- Run a short request and save the response with metrics.
- Immediately repeat the same request with no other changes.
- Compare loading and the other components separately.
If only load_duration decreased, the cold-load hypothesis has support. That still does not prove the entire gain is due only to retention: the repeated prompt may use cache. Take cache fields into account separately if they are present in your version of the response.
How to check whether the model is in memory
Documented command:
ollama psIt shows loaded models. In the PROCESSOR column, you can see whether the model is on CPU, GPU, or in a mixed setup; the description is in the Ollama FAQ. The list is available via the API at GET /api/ps: among the response fields are details about the model and memory.
Take the snapshot close to the query you are investigating. The presence of a model in the list ahead of time does not guarantee it will stay there under competing load. If multiple servers or containers are running, make sure the CLI and the application are talking to the same instance.
The recommended verification outcome is that you know the local model name, the server instance, and the actual placement. The mere presence of a GPU in the machine does not prove that a specific request ran on it.
When to use keep_alive and when to free memory
To verify retention, you can add a deadline to the request, for example "keep_alive": "10m". According to the FAQ, this parameter is supported in /api/generate and /api/chat and takes priority over the server variable OLLAMA_KEEP_ALIVE.
A Bash practice request, not executed in this work:
curl --fail-with-body http://localhost:11434/api/generate \
  -H 'Content-Type: application/json' \
  --data-binary '{"model":"llama3.2","prompt":"Answer in one word: ready?","stream":false,"keep_alive":"10m"}'
Before running it, replace llama3.2 with the name of your installed local model. The request may use memory and compute resources. stream: false returns a single response and makes metrics easier to read; the request format is described in Generate a response.
The recommended choice is to keep a frequently called model resident for a set period and release resources when other tasks need them. Keeping all models resident all the time is not a universal optimization: it changes how limited memory is allocated. Set the duration to match actual call intervals, then test behavior under normal load.
If load is low but the wait remains
Look at the input. A long chat thread, instructions, search results, and documents can all increase the amount of processing. A recommended experiment is to compare a short request with a production prompt on the same model and under the same load. Change one factor at a time while keeping the task meaning the same.
Do not strip context just to reduce duration: the response may become fast but useless. First determine which documents or messages are needed to solve the task, then test the quality of the reduced input. Input capabilities and fields should be checked against the generation API documentation.
If the problem is generating a long answer, estimate the required output length. For request classification, a category and a short explanation are often enough. Free-form long text generation is a different workload. The required format and field validation are covered in the JSON Schema guide in Ollama; a correct structure does not guarantee low latency.
Why pauses appear again under load
The FAQ describes request queuing when there is not enough memory to load the next model. That is why good single-request results cannot be directly applied to multiple users. Changing the number of concurrent requests also affects memory demand. Source: Ollama concurrent processing.
The suggested check is to first repeat the normal task alone, then with the usual number of concurrent users. Keep the actual concurrency, model mix, and input sizes. If the degradation appears only in the second case, first investigate the queue and resources rather than rewriting the entire prompt.
Do not increase concurrency blindly. A higher limit does not create extra memory. Choosing a different inference server is discussed in the comparison of vLLM, Ollama, llama.cpp, and SGLang, but changing the stack makes sense only after you identify the cause of the slowdown.
What to check if the GPU stopped being used
First compare ollama ps and the server messages. The troubleshooting guide describes log locations for different launch methods and how to diagnose GPU detection. The approach for a systemd service differs from a container and a desktop app.
The recommended sequence is to record the Ollama version, launch method, model, placement, and the log fragment related to the failure. Remove prompts, keys, and client data from any logs you share if they are there. Do not change drivers, libraries, and settings at the same time: otherwise it will be hard to tell which action affected the result.
The documentation includes options for specific hardware errors. Apply them only after confirming the matching symptom. This article does not claim that a driver update or model retention will solve every slow-response case.
How Vladimir Lomtev’s AI studio helps diagnose assistant latency
Vladimir Lomtev’s AI studio specializes in local LLM deployment, integration, and testing. For latency issues, the work may include separating application and model time, checking placement and memory, and comparing configuration options on the same business queries.
The first step is to choose one assistant operation, describe the current latency, input context sources, resource constraints, and acceptable response time. After that, you can discuss measurements and changes. Speed, support for a specific GPU, and final performance all need to be verified on the chosen configuration.
Bottom line: fix the confirmed cause
High load_duration points to model loading and retention. Long input processing duration points to the context composition. Slow generation points to the model, response length, and resources. Degradation only under contention requires checking load and memory. First get comparable observations, then change one factor and repeat the quality and timing check.